
Best real estate Dubai 2026 shows a late-cycle market with selective hotspots
Dubai’s property market is entering 2026 with strong demand, rising prices, and more selective opportunities. This Best real estate Dubai 2026 guide explains the top investment areas, price trends, rental yields, off-plan activity, and key risks for buyers, investors, and end users

Today's Market Snapshot
Dubai’s real estate cycle remains strong, but the easy phase is over. Dubai Land Department says the emirate’s real estate sector posted 2.78 million total procedures in 2024, with 226,000 real estate transactions worth AED 761 billion. DLD also reported more than 110,000 new investors in 2024, up 55% year on year.
By Q1 2026, DLD said transaction value had risen another 31% year on year to AED 252 billion, while transaction volume rose 6% to 60,303. That combination still signals momentum, but it also shows why the market now needs sharper underwriting: values are rising faster than volumes.
Knight Frank’s residential series shows the same pattern. Average residential prices rose 19.1% in 2024 to AED 1,685 per sq ft. In Q1 2025, citywide values reached AED 1,749 per sq ft. In Q2 2025 they reached AED 1,809 per sq ft. In Q1 2026 they reached AED 1,933 per sq ft, up 10.5% year on year. That is still a healthy market. It is just a less explosive one than in 2024.
Property Finder’s annual 2025 market review adds the demand side. It says Dubai benefited from net resident inflows of more than 200,000 in 2025, residential transactions rose 26% by value, and primary transactions outpaced secondary ones. The same report says apartments made up 93% of residential transactions in 2025, while villa prices still rose faster than apartment prices because supply stayed tighter.
The financing backdrop remained supportive by regional standards, even if cheap money is gone. The Central Bank of the UAE kept the base rate at 3.65% on 29 April 2026. That has not stopped the market, but it does mean investors must now depend more on rental income, payment-plan structure, and location quality than on pure leverage-driven upside.
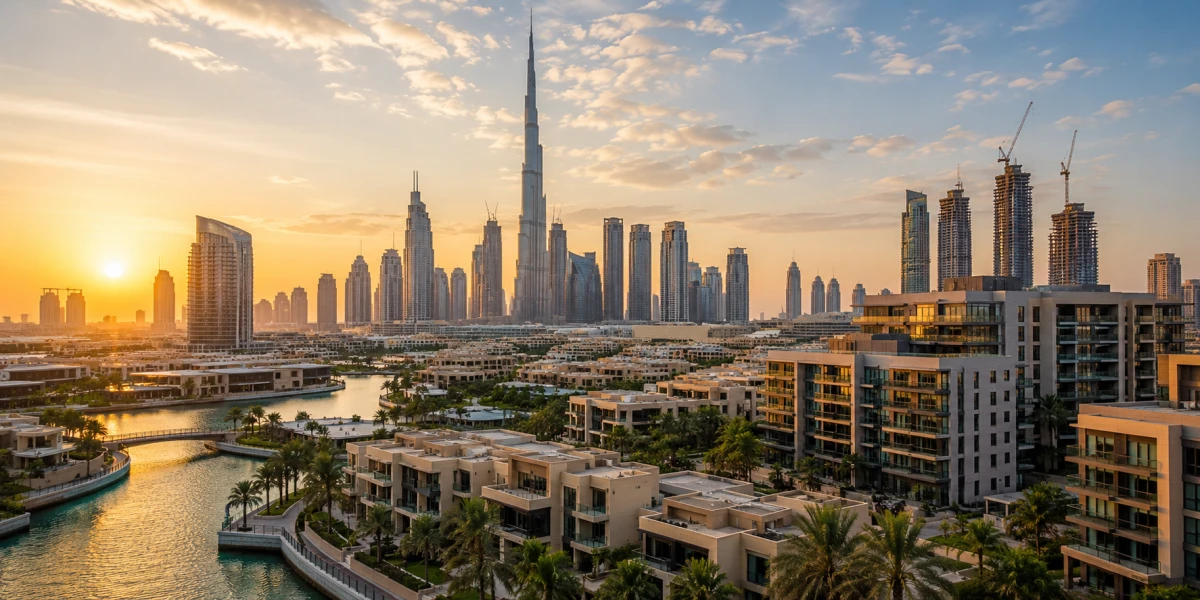
Dubai residential price trend
| Period | Citywide average price |
|---|---|
| Q4 2024 | AED 1,685 per sq ft |
| Q1 2025 | AED 1,749 per sq ft |
| Q2 2025 | AED 1,809 per sq ft |
| Q1 2026 | AED 1,933 per sq ft |
Chart note: Q4 2024 is the year-end average from Knight Frank’s Q4 2024 review. Q1 2025, Q2 2025, and Q1 2026 are quarter-end readings from Knight Frank market reviews.
“a two-speed market emerging”
— Shehzad Jamal, Knight Frank, on Dubai’s housing market in late 2025.
Neighborhood scoreboard
The table below is the clearest short answer to where value sits now. It uses Knight Frank’s Q1 2026 residential submarket table, which also carries comparable Q1 2024 and Q1 2025 readings. Those are blended submarket averages, not unit-type-specific medians. That matters. Palm Jumeirah and Dubai Hills are naturally lifted by high-value villa activity, while JVC and Business Bay are more apartment-heavy. Even so, the comparisons are useful because they are like-for-like within one source and one methodology.
| Neighborhood | Q1 2024 AED psf | Q1 2025 AED psf | Q1 2026 AED psf | YoY change | Two-year change | Q1 2026 deals |
|---|---|---|---|---|---|---|
| Downtown Dubai | 2,670 | 2,885 | 3,010 | 4.3% | 12.7% | 568 |
| Dubai Marina | 1,856 | 2,388 | 2,054 | -14.0% | 10.7% | 525 |
| Palm Jumeirah | 3,811 | 3,801 | 4,525 | 19.0% | 18.7% | 350 |
| Jumeirah Village Circle | 1,259 | 1,370 | 1,479 | 8.0% | 17.5% | 3,092 |
| Business Bay | 2,227 | 2,350 | 2,613 | 11.2% | 17.3% | 1,732 |
| Dubai Hills Estate | 2,274 | 2,424 | 2,527 | 4.2% | 11.1% | 2,527 |
Source and calculations: Knight Frank Q1 2026 Residential Market Review neighborhood table. YoY and two-year changes are calculated from the cited source.
The strongest mainstream reading belongs to JVC. It remains the most liquid of the six neighborhoods in this comparison, with 3,092 deals in Q1 2026, a submarket average of AED 1,479 per sq ft, and heavy off-plan and ready-market depth. It also leads the market by future pipeline, with 35,780 units under construction or registered in Knight Frank’s Q1 2026 supply table. That liquidity matters. It means JVC is not only a high-yield district. It is also one of Dubai’s easiest places to enter and exit.
Business Bay ranks next for investors who want a more urban, mixed-use profile. It reached AED 2,613 per sq ft in Q1 2026, up 11.2% year on year, and it holds the second-largest active supply pipeline at 23,923 units. Property Finder and Bayut both show that Business Bay is one of the few neighborhoods that works simultaneously as a residential, short-commute, and office-led location. That broadens exit options and keeps demand deep.
Dubai Hills Estate is the family and quality-bias pick. Its Q1 2026 submarket average was AED 2,527 per sq ft, with 2,527 deals recorded in the quarter. The pipeline is large at 12,645 units, but the district still benefits from stronger end-user pull than many newer launches because it already has schools, retail, a golf course, and maturing community infrastructure.
Downtown Dubai remains expensive, but it looks stable rather than overheated. Knight Frank says Downtown one-bedroom rents averaged AED 127,000 in 2025, the highest among the top apartment rental communities it tracked. That gives Downtown strong prestige and rental depth, but the yield story is weaker than in JVC or Business Bay.
Palm Jumeirah is still the premium benchmark. Knight Frank says the submarket averaged AED 4,525 per sq ft in Q1 2026, up 19% year on year, while Palm also remained the busiest prime community for ultra-luxury deals in Q3 2025. That makes it the clearest holding for capital preservation and global trophy demand, not for headline yield.
Dubai Marina needs a more careful read. It remains highly liquid and popular, but Knight Frank’s Q1 2026 submarket table shows AED 2,054 per sq ft, below the Q1 2025 reading in the same series. Bayut still shows strong long-run pricing and healthy expected ROI. Yet compared with JVC or Business Bay, Dubai Marina now looks more cyclical and more vulnerable to stock-age and congestion effects than it did earlier in the run.
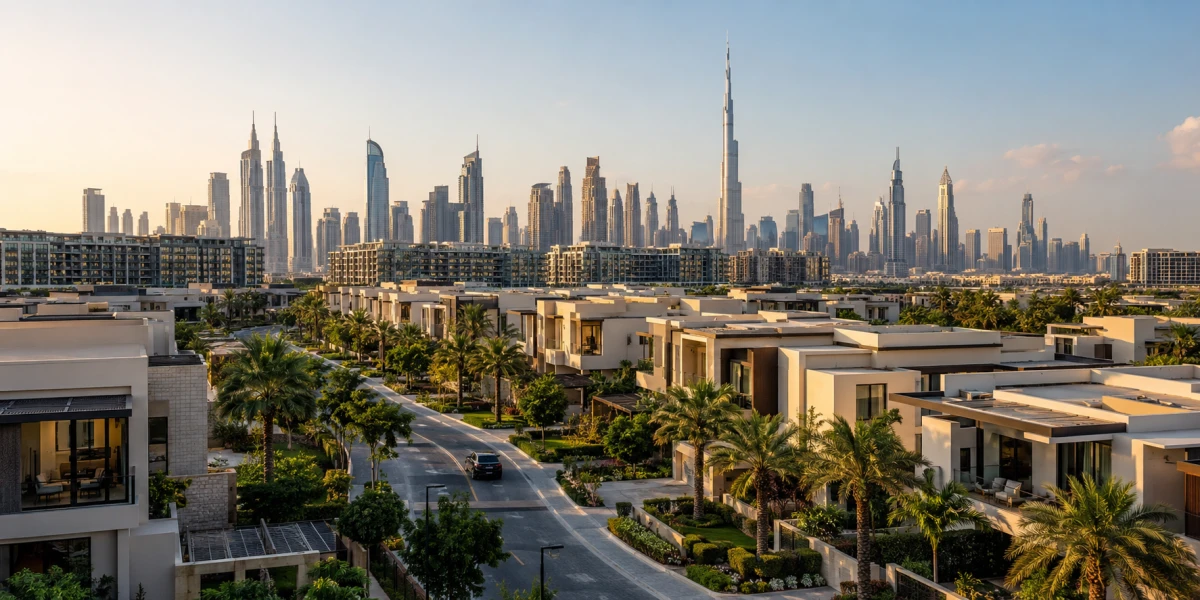
Segment analysis
Residential is still the core story. Knight Frank says villas outperformed apartments in 2024, Q1 2025, Q2 2025, and Q1 2026. Bayut’s 2025 sales report tells the same story at community level: Dubai Hills Estate villa prices rose strongly, and apartment values in JVC, Downtown Dubai, Business Bay, and Dubai Marina all remained above 2024 levels. The residential market is not stalling. It is separating into faster and slower lanes.
“driven by capital appreciation and a shift toward higher-value assets”
— Faisal Durrani, Knight Frank, on Dubai’s 2025 market profile.
Off-plan remains the growth engine. Bayut says off-plan accounted for 62.6% of all 2025 transactions, or 134,623 sales worth AED 293 billion. JVC led off-plan apartment sales with 12,285 transactions, while Business Bay recorded the highest off-plan apartment average transaction price at AED 2.38 million, equal to AED 2,672 per sq ft. Knight Frank then showed off-plan still at 72% of residential sales in Q1 2026. That is why the best districts for 2026 are also the districts with the deepest product pipeline and strongest absorption story.
Commercial is no longer a side story. Property Finder says Dubai’s commercial transaction value rose 61% in 2025 and that core commercial activity grew strongly in both primary and secondary markets. JLL said Dubai’s citywide office vacancy rate had already fallen to 8.6% in Q1 2025, while prime areas were effectively full at 0.2% vacancy. Those conditions help explain why Business Bay keeps appearing in both residential and commercial rankings. It also helps explain why mixed-use districts should trade at a premium in 2026.
Luxury remains structurally strong. Knight Frank recorded 500 home sales above US$10 million in 2025, with 68 deals above US$25 million. In Q1 2026, the same firm counted 193 transactions above US$10 million, the highest quarterly total on record. Palm Jumeirah remained the busiest prime neighborhood in Q3 2025, accounting for 34% of those super-prime deals. That supports the case for Palm as a scarcity play, even if advertised and transacted yields look lower than in the mid-market.
Rental income is still a competitive advantage, but only in parts of the city. Bayut’s 2025 data show that JVC and Business Bay offer stronger gross returns than Downtown Dubai or Palm Jumeirah. Knight Frank also found that JVC posted the largest annual apartment-rent increase among the top rental communities in 2025, while Business Bay rents rose 10%, Downtown led in one-bedroom annual rents, and Dubai Marina remained second. In short, the yield map and the prestige map are not the same thing.
Indicative gross yield by neighborhood
| Neighborhood | Indicative gross yield | Asset bias in yield reading | Read-through |
|---|---|---|---|
| Jumeirah Village Circle | 7.3%–7.4% | Apartments | Best yield/liquidity balance |
| Business Bay | 5.7%–6.6% | Apartments | Strong mixed-use income profile |
| Dubai Marina | 5.6%–6.2% | Apartments | Liquid, but more cyclical |
| Downtown Dubai | 5.2%–5.8% | Apartments | Premium core hold |
| Dubai Hills Estate | 4.2%–4.4% | Villas | Family-driven, lower yield, higher quality |
| Palm Jumeirah | About 4.0% | Villas | Trophy market, yield secondary |
Source note: Expected gross ROI figures come from Bayut’s 2025 sales market report and Bayut’s average-price-per-square-foot pages. They are listing-based expected returns, not audited net yields.
Q1 2026 Dubai residential sales mix
| Sales type | Share |
|---|---|
| Off-plan | 72% |
| Ready | 28% |
Chart note: Off-plan share from Knight Frank’s Q1 2026 residential market review.
Investment type comparison
| Investment type | Main advantage in 2026 | Main risk in 2026 | Best fit |
|---|---|---|---|
| Ready apartment | Immediate rent, easier financing visibility | Lower upside than launch-stage stock | Income investors |
| Off-plan apartment | Payment-plan flexibility, pipeline-led appreciation | Delivery slippage, launch saturation | Medium-term capital growth |
| Ready villa | Scarcity and strong end-user demand | Higher ticket size, lower gross yield | Family offices, end users |
| Off-plan villa/townhouse | Lifestyle shift plus limited supply | Execution risk, location dependence | Long-hold lifestyle investors |
| Office/commercial unit | Tight vacancy and rent growth in core markets | Fit-out costs and tenant concentration | Income-focused commercial buyers |
| Ultra-prime waterfront | Global wealth inflow, scarcity value | Lower yield, greater headline risk sensitivity | Capital preservation |
Source note: The strengths and risks summarize DLD, Knight Frank, JLL, and Property Finder evidence on transaction mix, supply, vacancy, and rent trends.
“The sustained confidence of our customers and investors enables us to maintain momentum.”
— Mohamed Alabbar, founder of Emaar.
Outlook
The best real estate Dubai 2026 call is not “buy prime” or “buy off-plan.” It is narrower. JVC is the best yield-adjusted mainstream district. Business Bay is the best mixed-use growth district. Dubai Hills Estate is the best family-prime compound. Downtown Dubai is the safest core urban hold. Palm Jumeirah is the strongest trophy market. Dubai Marina is still investable, but only at the right entry price and with more caution than in 2024 or early 2025.
The biggest near-term variable is supply. Knight Frank says more than 160,000 units could enter the market in 2026 on paper, but it also says actual on-time delivery is likely to be much lower. In its Q1 2026 review, the firm estimated only 95,649 units may complete on time, against a larger forecast pipeline. That means oversupply risk is real, but it is not uniform. It is highest where launch volume is heavy and community differentiation is weak.
My transparent base-case estimate, derived from Q1 2026 run-rate data and then tempered by Knight Frank’s and CBRE’s moderation signals, is that 2026 is likely to end with roughly 175,000 to 185,000 residential sales and AED 525 billion to AED 550 billion in residential value. A straight annualization of Q1 2026 would imply about 181,000 deals and AED 549 billion. I am keeping the range wide because Q1 was strong, but the same period also marked a clearer late-cycle slowdown in price growth and a more supply-heavy backdrop.
A final point matters for 2026: innovation is becoming a market differentiator. DLD launched phase two of its real-estate tokenization project in February 2026, and VARA confirmed the pilot had moved into controlled testing focused on secondary-market mechanisms. That is not yet a mass-market investment lane. But it is a serious signal that Dubai wants to turn real estate into a more liquid, regulated, and digitally divisible asset class over time.
Methodology and limitations
This report combines official market releases, broker research, portal intelligence, and one original comparative dataset. Citywide 2024 and Q1 2026 transaction figures come from Dubai Land Department. Citywide residential price trend points for Q4 2024, Q1 2025, Q2 2025, and Q1 2026 come from Knight Frank. The neighborhood comparison table is original synthesis based on Knight Frank’s Q1 2026 submarket matrix, which includes Q1 2024, Q1 2025, and Q1 2026 values and deal counts on one visual table. Rental-yield comparisons use Bayut’s latest published 2025 ROI estimates. Commercial context comes from Property Finder and JLL.
Two limits should be kept in mind. First, DLD “real estate transactions” and Knight Frank “residential sales” are not the same dataset, so I kept those series separate. Second, neighborhood prices are submarket averages, not unit-type medians, while the yield estimates are listing-based expected gross returns rather than realized net yields. Where exact full-year 2026 data do not yet exist, estimates are explicitly labeled as estimates.
References
- Dubai Land Department, Dubai’s Real Estate Sector records AED 761 billion in transactions in 2024.
- Dubai Land Department, Dubai Real Estate Sector Strategy 2033 poised to drive significant growth.
- Dubai Land Department, Annual Report: Real Estate Sector Performance 2024.
- Dubai Land Department, Dubai’s real estate transactions surge 31% to reach AED 252 billion in Q1 2026.
- Dubai Land Department, Dubai’s rental sector records strong growth in 2025.
- Dubai Land Department, Dubai’s rental market charts stable trajectory in Q1 2026.
- Dubai Land Department, Dubai Land Department launches Smart Rental Index 2025.
- Dubai Land Department, Dubai’s real estate brokerage sector transformation in 2025.
- Dubai Land Department, Phase II of the Real Estate Tokenisation Project.
- Knight Frank, Dubai residential prices surge by 19% in 2024 amid rising demand.
- Knight Frank, Dubai Residential Market Review Q1 2025.
- Knight Frank, Dubai residential prices climb 13.7% year-on-year.
- Knight Frank, Dubai Residential Market Review Q3 2025.
- Knight Frank, Growth gap between luxury and mainstream markets widens in record year for Dubai residential sales.
- Knight Frank, Dubai Residential Market Review Q1 2026.
- Knight Frank, Q1 2026 neighborhood table.
- Knight Frank, Q3 2025 apartment submarket performance.
- Knight Frank, Q3 2025 villa submarket performance.
- Knight Frank, Record-breaking 500 US$10 million+ homes sell in Dubai during 2025.
- Knight Frank, Dubai’s ultra-luxury homes drive 24% annual increase in US$10 million-plus sales.
- CBRE, UAE Real Estate Market Ends 2025 on a High Note.
- Emaar Development, Q1 2026 property sales up 22%.
- Property Finder, Market Watch: A Year in Review 2025.
- Bayut, Dubai Sales Market Report 2025.
- Bayut, Dubai Off-plan Market Report 2025.
- Bayut, Dubai Rental Market Report 2025.
- Bayut, Average price per square foot in Dubai: villas and apartments.
- JLL, UAE Office Market Dynamics Q1 2025.
- Central Bank of the UAE, CBUAE Maintains the Base Rate at 3.65%.
- VARA, Update on the Real Estate Tokenisation Pilot.
- Central Bank of the UAE, 2025 Annual Report press release.
What's Your Reaction?
 Like
0
Like
0
 Dislike
0
Dislike
0
 Love
0
Love
0
 Funny
0
Funny
0
 Wow
0
Wow
0
 Sad
0
Sad
0
 Angry
0
Angry
0

Finance news and analysis writer with two years of experience covering markets, AI, cryptocurrency, fintech, blockchain, investment trends, and digital economy developments for global readers.
Comments (0)